Charts and Graphs for PHP
Powered by the Google Chart API


Introduction
Lavacharts is a wrapper for Google's powerful Javascript Chart API
- The Lavacharts library takes away the need for manual writing of Javascript in your views
- The library wraps the work of generating the proper Javascript, so you can focus on the data and not the JS in page.
- Configuration is intuitive and easy to follow since it correlates 1:1 with the Google Chart API.
- Designed to work with any PHP project, but some extra features were added for Laravel & Symfony users.
- For Laravel designers, included are a ServiceProvider, Facade, and Blade template extensions.
- For Symfony designers, a Bundle to add Lavacharts to the service container and Twig template extensions.
Installation
Get up and running within minutes with Composer.
If you don't know about Composer, I would highly recommend visiting their site and learning how to use it in your projects.
Composer Projects
First, copy this line into your project's composer.json file, in the "require": {} section
Next, run composer to download and install
$ composer updateFinally, require('vendor/autoload.php'); in your project and you are good to go!
Laravel
Service Provider
First step, register the service provider by adding the class namespace to the providers array in app/config/app.php
"providers" => [
    ...

    'Khill\Lavacharts\Laravel\LavachartsServiceProvider',
]
If you are using PHP 5.5+, then you can use the new ::class syntax to reference the Service Provider.
Khill\Lavacharts\Laravel\LavachartsServiceProvider::classFacade / Alias
The functionality is based upon the single instance of the library, so it is strongly recommended to add the Lava alias for ease of use throughout your application.
"aliases" => [
    ...

    'Lava' => 'Khill\Lavacharts\Laravel\LavachartsFacade',
]
Same as the service provider, if you are using PHP 5.5+, you can use the ::class syntax.
Khill\Lavacharts\Laravel\LavachartsFacade::classRemember, many examples show $lava-> but while using Laravel, enable the alias and use \Lava:: instead.
Manual (w/o Composer)
First, grab the most recent copy of the source from Github using this link:
You will also need to get a copy of the Carbon Library since it the DataTables depend on Carbon.
Then, include Carbon and Lavacharts and create a new instance of the library.
<?php

include(/* path to unzipped carbon archive */     . '/src/Carbon/Carbon.php')
include(/* path to unzipped lavacharts archive */ . '/src/Lavacharts.php');

$lava = new \Khill\Lavacharts\Lavacharts;
Getting Started
Getting up and running with Lavacharts is a breeze and if you follow along, you will learn how Lavacharts works. If you want some real working examples just jump down and take a look. Following these steps will show you how to create a DataTable, add columns and rows, add data, and finally render the chart into the page.
DataTable
Creating a new DataTable for your chart.
The following is a simple example, just to get you up and running.
For an in-depth look at DataTables, Click Here or use the link from the menu.
- First, create a new DataTable object using the method from Lavcharts.
- Next, add some columns, defining the structure of the chart's data.
addDateColumn($description)for datesaddTimeOfDayColumn($description)for times of the dayaddNumberColumn($description)for numbersaddStringColumn($description)for stringsaddBooleanColumn($description)for boolean valuesaddRoleColumn($description)for roles
- In this example, the first column is the horizontal axis, then then next two columns are the two sets of data.
- The
addRow()method signature, follows the order in which the columns were added.
So here, data[0] is for 'day', data[1] is for 'projected' and data[2] is for 'official'
<?php

$stocksTable = $lava->DataTable();  // Lava::DataTable() if using Laravel

$stocksTable->addDateColumn('Day of Month')
            ->addNumberColumn('Projected')
            ->addNumberColumn('Official');

// Random Data For Example
for ($a = 1; $a < 30; $a++) {
    $stocksTable->addRow([
      '2015-10-' . $a, rand(800,1000), rand(800,1000)
    ]);
}
Chart
Creating and customizing your chart.
Select which type of chart you will be creating. In this example, we will use LineChart, but Lavacharts currently supports:
- AreaCharts
- BarCharts
- CalendarCharts
- ColumnCharts
- ComboCharts
- DonutCharts
- GaugeCharts
- GeoCharts
- PieCharts
- LineCharts
- ScatterCharts
<?php

$chart = $lava->LineChart('MyStocks', $stocksTable);
// $chart = Lava::LineChart() if using LaravelOutput
Rendering the chart
All you need to do in your view, is use the render method and the library will output all of the neccessary javascript into the page.
Syntax: render(chartType, chartLabel, elementId)
<?php

// If this is the div you want your chart to appear in, then call:
// <div id="stocks-chart"></div>
echo $lava->render('LineChart', 'MyStocks', 'stocks-chart');Upgrade Guide
Upgrading from 2.5.x -> 3.0.x
In an effort to keep chart creation terse, the chart constructor has been extended. Charts now set the DataTable with the second parameter, and options if needed with the third.
Chart Constructor
The constructor now takes two more arguments, the DataTable and optional configuration options.
2.5.x method
<?php

$data = $lava->DataTable();

$lava->LineChart('StockPrices')
     ->setOptions(array(
         'title'     => 'Github Stock Price',
         'datatable' => $data
     ));
3.0.x method
<?php

$data = $lava->DataTable();

$lava->LineChart('StockPrices', $data, [
    'title' => 'Github Stock Price'
]);
Config Objects
Following the effort to reduce typing for the developer, ConfigObjects are no longer required to be instantiated manually. Just pass in the same config array you would have passed to the constructor, as a value to the key. Internally, a ConfigObject will be created and options will be checked/verified/assigned and applied to the chart, same as before.
2.5.x method
<?php

$data = $lava->DataTable();

$lava->LineChart('StockPrices')->setOptions(array(
    'datatable' => $data,
    'titleTextStyle' => $lava->TextStyle(array(
        'fontName'  => 'Arial',
        'fontColor' => 'blue'
    )),
    'legend' => $lava->Legend(array(
        'position' => 'top'
    ))
));
3.0.x method
<?php

$data = $lava->DataTable();

$lava->LineChart('StockPrices', $data, [
    'titleTextStyle' => [
        'fontName' => 'Arial',
        'fontColor' => 'blue'
    ],
    'legend' => [
        'position' => 'top'
    ]
]);
Lavacharts
These methods are available from the main Lavacharts class.
Utility Methods
Creates new instance of a DataTable.
Creates new instance of a dashboard.
Output the necessary javascript tags for getting the chart onto the page.
Checks if the Chart exists in the Volcano (The library's internal storage class)
This method with output the script tag for the google jsapi, along with lava.js; A custom module for lavacharts.
Used with Angular so the script tag is not placed inside an ng-view and can be manually placed in the header / footer.
Charts
Formats
DataTables
What's a chart without data?
Columns
For convenience, the common column types have their own dedicated methods. They are alias methods, which will internally call the addColumn() method, with some values automatically filled; Type and Label.
If you want to explicitly add columns, then there are methods for you to do so. You can using strings, arrays, or multi-dimensional arrays.
TypeDefines the type of data that will be in the column.DescriptionThe description of the column. (optional)LabelA label used to access specific columns. (optional)FormatThe desired format for the column. (optional)
Other column related methods
Rows
Add rows either by chaining the single row command, or batch adding with the addRows() method.
- Note: Each row array added, must have the same number of data points as the number of columns.
Other row related methods
Formats
Customize the appearance of your data
Columns can have formats applied so the data/labels will be shown according to the format definition.
ArrowFormat
Currently supported configuration options:
arrow is missingBarFormat
Currently supported configuration options:
bar is missingDateFormat
Currently supported configuration options:
$lava->DateFormat([
    'formatType' => 'string',
    'pattern'    => 'string',
    'timezone'   => 'string'
]);
Explanations of each of the configuration options can be found in Google's Documentation
NumberFormat
Currently supported configuration options:
$lava->NumberFormat([
    'decimalSymbol'  => 'string',
    'fractionDigits' => int,
    'groupingSymbol' => 'string',
    'negativeColor'  => 'string',
    'negativeParens' => bool,
    'pattern'        => 'string',
    'prefix'         => 'string',
    'suffix'         => 'string'
]);
Explanations of each of the configuration options can be found in Google's Documentation
Utility Methods
Set the timezone to be used for Date, DateTime, and TimeOfDay columns. Defaults to America/Los_Angeles
If using string dates, maybe to represent only years such as "2000" and they are not being interpreted correctly, then use this method to set the format string for the whole DataTable.
Use a format string following the DateTime format
Get the JSON representation of a DataTable, useful for loading chart data via AJAX. (See Example)
Charts
Select a chart from the dropdown or sidebar menu to see the different configuration methods / options available.
Create a new chart by calling from the top level Lava object, $lava-> if not using Laravel, or Lava:: when using the alias via service provider.
All of the methods below are also available to all of the charts, as all charts extend the parent Chart
Parent Chart
All of the different charts extend from the parent chart, to provide common options and methods for all charts.
Methods
These methods are available to all charts:
setOptions()getDataTableJson()
Options
These options are available to all charts:
<?php

$lava->Chart('Title', $DataTable, [
    'backgroundColor'   => [array],   //BackgroundColor Options
    'chartArea'         => [array],   //ChartArea Options
    'colors'            => [array],
    'events'            => [array],   //Associative array of events to callbacks
    'fontSize'          => int,
    'fontName'          => 'string',
    'height'            => int,
    'legend'            => [array],   //Legend Options
    'title'             => 'string',
    'titlePosition'     => 'string',
    'titleTextStyle'    => [array],   //TextStyle Options
    'tooltip'           => [array],   //Tooltip Options
    'width'             => int
]);
Learn More
Jump to the available options for the different configuration options.
AreaChart
Currently supported configuration options:
<?php

$lava->AreaChart('Title', $DataTable, [
    'areaOpacity'        => float,
    'axisTitlesPosition' => 'string',
    'hAxis'              => [array],   //HorizontalAxis Options
    'interpolateNulls'   => bool,
    'lineWidth'          => int,
    'pointSize'          => int,
    'vAxis'              => [array],   //VerticalAxis Options
]);
Learn more about:
Explanations for each of the configuration options can be found in Google's Documentation
BarChart
Currently supported configuration options:
<?php

$lava->BarChart('Title', $DataTable, [
    'annotations'         => [array],        //Annotation Options
    'axisTitlesPosition'  => 'string',
    'barGroupWidth'       => int | 'string'  //As a percent, "33%"
    'dataOpacity'         => float,
    'enableInteractivity' => bool,
    'focusTarget'         => 'string',
    'forceIFrame'         => bool,
    'hAxes'               => [array],        //Arrays of HorizontalAxis Options
    'hAxis'               => [array],        //HorizontalAxis Options
    'orientation'         => 'string',
    'isStacked'           => bool,
    'reverseCategories'   => bool,
    'series'              => [array],        //Numerically indexed, arrays of Series Options
    'theme'               => 'string',
    'vAxis'               => [array],        //VerticalAxis Options
]);
Learn more about:
Explanations for each of the configuration options can be found in Google's Documentation
CalendarChart
Currently supported configuration options:
<?php

$lava->CalendarChart('Title', $DataTable, [s
    'cellColor'               => [array],   //Stroke options
    'cellSize'                => int,
    'dayOfWeekLabel'          => [array],   //TextStyle options
    'dayOfWeekRightSpace'     => int,
    'daysOfWeek'              => 'string',
    'focusedCellColor'        => [array],   //Stroke options
    'monthLabel'              => [array],   //TextStyle options
    'monthOutlineColor'       => [array],   //Stroke options
    'underMonthSpace'         => int,
    'underYearSpace'          => int,
    'unusedMonthOutlineColor' => [array],   //Stroke options
    'colorAxis'               => [array],   //ColorAxis options
    'forceIFrame'             => bool,
    'noDataPattern'           => [array],   //Color options

]);
Learn more about:
Explanations for each of the configuration options can be found in Google's Documentation
ColumnChart
Currently supported configuration options:
<?php

$lava->ColumnChart('Title', $DataTable, [
    'axisTitlesPosition' => 'string',
    'bar'                => [array],        //bar Options i.e 'groupWidth'=> '95%'
    'hAxis'              => [array],        //HorizontalAxis Options
    'isStacked'          => bool,
    'pointSize'          => int,
    'vAxis'              => [array],        //VerticalAxis Options
]);
Learn more about:
Explanations for each of the configuration options can be found in Google's Documentation
ComboChart
Currently supported configuration options:
<?php

$lava->ComboChart('Title', $DataTable, [
    'annotations'        => [array],       //Annotation Options
    'areaOpacity'        => 'float',
    'axisTitlesPosition' => 'string',
    'barGroupWidth'      => int | 'string' //As a percent, "33%"
    'hAxis'              => [array],       //HorizontalAxis Options
    'isStacked'          => bool,
    'series'             => [array],       //Numerically indexed, arrays of Series Options
    'seriesType'         => 'string',
    'lineWidth'          => int,
    'pointSize'          => int,
    'vAxes'              => [array],       //Arrays of vAxis Options
    'vAxis'              => [array],       //VerticalAxis Options
]);
Learn more about:
Explanations for each of the configuration options can be found in Google's Documentation
DonutChart
This is a special version of a PieChart, so it shares all the same options.
Currently supported configuration options:
<?php

$lava->DonutChart('Title', $DataTable, [
    // Available PieChart Options,
    'pieHole' => float
]);
Learn more about:
Explanations for each of the configuration options can be found in Google's Documentation
GaugeChart
Currently supported configuration options:
<?php

$lava->GaugeChart('Title', $DataTable, [
    'forceIFrame' => bool,
    'greenColor'  => 'string',
    'greenFrom'   => int,
    'greenTo'     => int,
    'majorTicks'  => [array],
    'max'         => int,
    'min'         => int,
    'minorTicks'  => [array],
    'redColor'    => 'string',
    'redFrom'     => int,
    'redTo'       => int,
    'yellowColor' => 'string',
    'yellowFrom'  => int,
    'yellowTo'    => int,
]);
Learn more about:
Explanations for each of the configuration options can be found in Google's Documentation
GeoChart
Currently supported configuration options:
<?php

$lava->GeoChart('Title', $DataTable, [
    'colorAxis'                 => [array],   //ColorAxis Options
    'datalessRegionColor'       => 'string',
    'displayMode'               => 'string',
    'enableRegionInteractivity' => bool,
    'keepAspectRatio'           => bool,
    'region'                    => 'string',
    'magnifyingGlass'           => [array]    //MagnifyingGlass Options
    'markerOpacity'             => float,
    'resolution'                => 'string',
    'sizeAxis'                  => [array]    //SizeAxis Options
]);
Learn more about:
Explanations for each of the configuration options can be found in Google's Documentation
PieChart
Currently supported configuration options:
<?php

$lava->PieChart('Title', $DataTable, [
    'is3D'                     => bool,
    'slices'                   => [array],   //Arrays of Slice Options
    'pieSliceBorderColor'      => 'string',
    'pieSliceText'             => 'string',
    'pieSliceTextStyle'        => [array],   //TextStyle options
    'pieStartAngle'            => int,
    'reverseCategories'        => bool,
    'sliceVisibilityThreshold' => int | float,
    'pieResidueSliceColor'     => 'string',
    'pieResidueSliceLabel'     => 'string'
]);
Learn more about:
Explanations for each of the configuration options can be found in Google's Documentation
LineChart
Currently supported configuration options:
<?php

$lava->LineChart('Title', $DataTable, [
    'axisTitlesPosition' => 'string',
    'curveType'          => 'string',
    'hAxis'              => [array],   //HorizontalAxis Options
    'interpolateNulls'   => bool,
    'lineWidth'          => int,
    'pointSize'          => int,
    'vAxis'              => [array],   //VerticalAxis Options
]);
Learn more about:
Explanations for each of the configuration options can be found in Google's Documentation
ScatterChart
FINISH THESE
Currently supported configuration options:
<?php

$lava->ScatterChart('Title', $DataTable, [
    'axisTitlesPosition' => 'string',
    'curveType'          => 'string',
    'hAxis'              => [array],   //HorizontalAxis Options
    'interpolateNulls'   => bool,
    'lineWidth'          => int,
    'pointSize'          => int,
    'vAxis'              => [array],   //VerticalAxis Options
]);
Learn more about:
Explanations for each of the configuration options can be found in Google's Documentation
Dashboards
Create dynamic data displays.
Dashboards are charts that have controls and filters attached to them to enable altering the view of the data through the controls.
For example, You want to view a sub-set of your data, you can attach a number filter, and change the display of the chart through number sliders.
To break it down into parts, a dashboard is created by:
- Creating a chart, or charts, to display in the dashboard.
- Creating Filters to alter the Chart's display.
- Wrapping the Filters in
ControlWrappers() - Wrapping the Charts in
ChartWrappers() - Binding the Control to the Chart and adding to the Dashboard.
Creation
Same as charts, dashboards need a label. Pass this as the only parameter to the constructor.
<?php

$dashboard = $lava->Dashboard('MyDash');
The one method you will need from the Dashboard is bind() to attach a ControlWrapper to a ChartWrapper and add it to the dashboard.
OneToOne, OneToMany, ManyToOne, and ManyToMany. This is why the bind() method accepts arrays as well as objects.
Filters
Filters are used alter the appearance of a Chart by filtering the DataTable. Used within a ControlWrapper(), filters work with the controls to alter the chart's display.
All filters need a previously created Chart with a DataTable.
The first parameter is either the DataTable's column index or label, and the second parameter is an optional array of customization options.
For example:
<?php

$filter = $lava->NumberRangeFilter(1 [, arrayOfOptions ]);
// OR
$filter = $lava->NumberRangeFilter('ThisSpecificColumn' [, arrayOfOptions ]);
Category
<?php

$categoryFilter = $lava->CategoryFilter(int|'string', [
    'caption'              => 'string',
    'sortValues'           => bool,
    'selectedValuesLayout' => 'string',
    'allowNone'            => bool,
    'allowMultiple'        => bool,
    'allowTyping'          => bool
]);
ChartRange
<?php

$chartRange = $lava->ChartRangeFilter(int|'string', [
    'chartType'    => 'string',
    'chartOptions' => //Not yet implemented,
    'chartView'    => //Not yet implemented,
    'minRangeSize' => int|float,
    'snapToData'   => bool
]);
DateRange
<?php

$dateRange = $lava->DateRangeFilter(int|'string', [
    'minValue' => int|float,
    'maxValue' => int|float,
    'format'   => 'string'
]);
NumberRange
<?php

$numberRange = $lava->NumberRangeFilter(int|'string', [
    'minValue' => int|float,
    'maxValue' => int|float,
    'format'   => 'string'
]);
String
<?php

$string = $lava->StringFilter(int|'string', [
    'matchType'         => 'string',
    'caseSensitive'     => bool,
    'useFormattedValue' => bool,
    'realtimeTrigger'   => 'string'
]);
More information can be found on Google's Website
ControlWrappers
After creating a filter, you wrap it with a control that will allow the view of the chart to be changed.
Pass in one of the filters and the HTML element id where the dashboard's control is to be rendered.
ChartWrappers
Next step is to add a chart to the dashboard. (This should have already been created with your options and data)
Pass in your created chart and the HTML element id where the dashboard's chart is to be rendered.
Binding
Lastly, bind the control to the chart into the dashboard.
It helps to remember the syntax that you bind a control to a chart, not a chart to a control.
<?php

$dashboard->bind($controlWrapper, $chartWrapper);
Rendering
The render method from the lava object will render dashboards too.
Instead of a chart type, put Dashboard for the first parameter, then the dashboard label, and an element id.
<?php

$lava->render('Dashboard', 'MyDash', 'dash-elem');Here is a working example of the a simple dashboard.
Controller
View
Examples
Here are a few examples of the types of charts you can create.
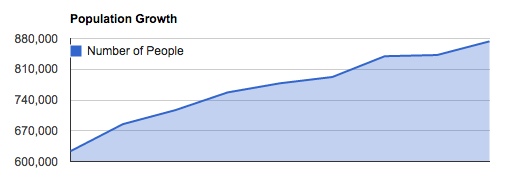
AreaChart Example
Controller
<?php

use Khill\Lavacharts\Lavacharts;

$lava = new Lavacharts; // See note below for Laravel

$population = $lava->DataTable();

$population->addDateColumn('Year')
           ->addNumberColumn('Number of People')
           ->addRow(['2006', 623452])
           ->addRow(['2007', 685034])
           ->addRow(['2008', 716845])
           ->addRow(['2009', 757254])
           ->addRow(['2010', 778034])
           ->addRow(['2011', 792353])
           ->addRow(['2012', 839657])
           ->addRow(['2013', 842367])
           ->addRow(['2014', 873490]);

$lava->AreaChart('Population', $population, [
    'title' => 'Population Growth',
    'legend' => [
        'position' => 'in'
    ]
]);
For Laravel, omit "$lava = new Lavacharts" and replace "$lava->" with "Lava::"
Otherwise, pass $areachart or $lava to your view to render.
View
Vanilla
<?php

<div id="pop_div"></div>
// With the lava object
<?= $lava->render('AreaChart', 'Population', 'pop_div') ?>
Laravel
<?php

<div id="pop_div"></div>
// With Lava class alias
<?= Lava::render('AreaChart', 'Population', 'pop_div') ?>

// With Blade Templates
@areachart('Population', 'pop_div')
Rendered Chart
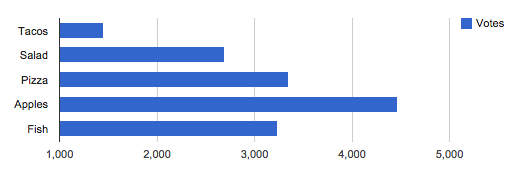
BarChart Example
Controller
<?php

use Khill\Lavacharts\Lavacharts;

$lava = new Lavacharts; // See note below for Laravel

$votes  = $lava->DataTable();

$votes->addStringColumn('Food Poll')
      ->addNumberColumn('Votes')
      ->addRow(['Tacos',  rand(1000,5000)])
      ->addRow(['Salad',  rand(1000,5000)])
      ->addRow(['Pizza',  rand(1000,5000)])
      ->addRow(['Apples', rand(1000,5000)])
      ->addRow(['Fish',   rand(1000,5000)]);

$lava->BarChart('Votes', $votes);
For Laravel, omit "$lava = new Lavacharts" and replace "$lava->" with "Lava::"
Otherwise, pass $barchart or $lava to your view to render.
View
Vanilla
<?php

<div id="poll_div"></div>
// With the lava object
<?= $lava->render('BarChart', 'Food Poll', 'poll_div') ?>
Laravel
<?php

<div id="poll_div"></div>
// With Lava class alias
<?= Lava::render('BarChart', 'Food Poll', 'poll_div') ?>

// With Blade Templates
@barchart('Food Poll', 'poll_div')
Rendered Chart
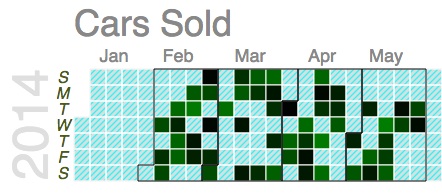
CalendarChart Example
Controller
<?php

use Khill\Lavacharts\Lavacharts;

$lava = new Lavacharts; // See note below for Laravel

$sales = $lava->DataTable();

$sales->addDateColumn('Date')
      ->addNumberColumn('Orders');

foreach (range(2, 5) as $month) {
    for ($a=0; $a < 20; $a++) {
        $day = rand(1, 30);
        $sales->addRow(["2014-${month}-${day}", rand(0,100)]);
    }
}

$lava->CalendarChart('Sales', $sales, [
    'title' => 'Cars Sold',
    'unusedMonthOutlineColor' => [
        'stroke'        => '#ECECEC',
        'strokeOpacity' => 0.75,
        'strokeWidth'   => 1
    ],
    'dayOfWeekLabel' => [
        'color'    => '#4f5b0d',
        'fontSize' => 16,
        'italic'   => true
    ],
    'noDataPattern' => [
        'color' => '#DDD',
        'backgroundColor' => '#11FFFF'
    ],
    'colorAxis' => [
        'values' => [0, 100],
        'colors' => ['black', 'green']
    ]
]);
For Laravel, omit "$lava = new Lavacharts" and replace "$lava->" with "Lava::"
Otherwise, pass $calendarchart or $lava to your view to render.
View
Vanilla
<?php

<div id="sales_div"></div>
// With the lava object
<?= $lava->render('CalendarChart', 'Sales', 'sales_div') ?>
Laravel
<?php

<div id="sales_div"></div>
// With Lava class alias
<?= Lava::render('CalendarChart', 'Sales', 'sales_div') ?>

// With Blade Templates
@calendarchart('Sales', 'sales_div')
Rendered Chart
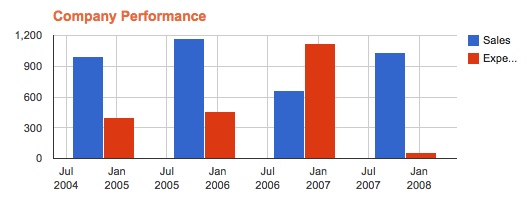
ColumnChart Example
Controller
<?php

use Khill\Lavacharts\Lavacharts;

$lava = new Lavacharts; // See note below for Laravel

$finances = $lava->DataTable();

$finances->addDateColumn('Year')
         ->addNumberColumn('Sales')
         ->addNumberColumn('Expenses')
         ->setDateTimeFormat('Y')
         ->addRow(['2004', 1000, 400])
         ->addRow(['2005', 1170, 460])
         ->addRow(['2006', 660, 1120])
         ->addRow(['2007', 1030, 54]);

$lava->ColumnChart('Finances', $finances, [
    'title' => 'Company Performance',
    'titleTextStyle' => [
        'color'    => '#eb6b2c',
        'fontSize' => 14
    ]
]);
For Laravel, omit "$lava = new Lavacharts" and replace "$lava->" with "Lava::"
Otherwise, pass $columnchart or $lava to your view to render.
View
Vanilla
<?php

<div id="perf_div"></div>
// With the lava object
<?= $lava->render('ColumnChart', 'Finances', 'perf_div') ?>
Laravel
<?php

<div id="perf_div"></div>
// With Lava class alias
<?= Lava::render('ColumnChart', 'Finances', 'perf_div') ?>

// With Blade Templates
@columnchart('Finances', 'perf_div')
Rendered Chart
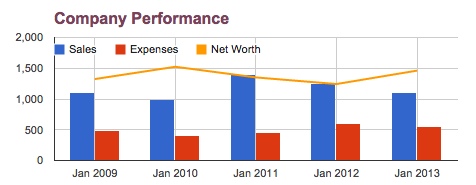
ComboChart Example
Controller
<?php

use Khill\Lavacharts\Lavacharts;

$lava = new Lavacharts; // See note below for Laravel

$finances = $lava->DataTable();

$finances->addDateColumn('Year')
         ->addNumberColumn('Sales')
         ->addNumberColumn('Expenses')
         ->addNumberColumn('Net Worth')
         ->addRow(['2009-1-1', 1100, 490, 1324])
         ->addRow(['2010-1-1', 1000, 400, 1524])
         ->addRow(['2011-1-1', 1400, 450, 1351])
         ->addRow(['2012-1-1', 1250, 600, 1243])
         ->addRow(['2013-1-1', 1100, 550, 1462]);

$lava->ComboChart('Finances', $finances, [
    'title' => 'Company Performance',
    'titleTextStyle' => [
        'color'    => 'rgb(123, 65, 89)',
        'fontSize' => 16
    ],
    'legend' => [
        'position' => 'in'
    ],
    'seriesType' => 'bars',
    'series' => [
        2 => ['type' => 'line']
    ]
]);
// Note: In the series config, '2' correlates to the 3rd horizontal axis dataset.
// The DateColumn is the VerticalAxis, so 'Net Worth' is the 3rd, key 2, in the series.
For Laravel, omit "$lava = new Lavacharts" and replace "$lava->" with "Lava::"
Otherwise, pass $combochart or $lava to your view to render.
View
Vanilla
<?php

<div id="finances-div"></div>
// With the lava object
<?= $lava->render('ComboChart', 'Finances', 'finances-div') ?>
Laravel
<?php

<div id="finances-div"></div>
// With Lava class alias
<?= Lava::render('ComboChart', 'Finances', 'finances-div') ?>

// With Blade Templates
@combochart('Finances', 'finances-div')
Rendered Chart
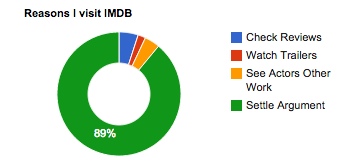
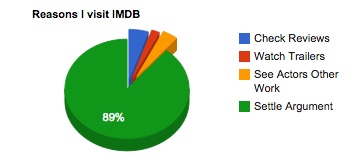
DonutChart Example
Controller
<?php

use Khill\Lavacharts\Lavacharts;

$lava = new Lavacharts; // See note below for Laravel

$reasons = $lava->DataTable();

$reasons->addStringColumn('Reasons')
        ->addNumberColumn('Percent')
        ->addRow(['Check Reviews', 5])
        ->addRow(['Watch Trailers', 2])
        ->addRow(['See Actors Other Work', 4])
        ->addRow(['Settle Argument', 89]);

$lava->DonutChart('IMDB', $reasons, [
    'title' => 'Reasons I visit IMDB'
]);
For Laravel, omit "$lava = new Lavacharts" and replace "$lava->" with "Lava::"
Otherwise, pass $donutchart or $lava to your view to render.
View
Vanilla
<?php

<div id="chart-div"></div>
// With the lava object
<?= $lava->render('DonutChart', 'IMDB', 'chart-div') ?>
Laravel
<?php

<div id="chart-div"></div>
// With Lava class alias
<?= Lava::render('DonutChart', 'IMDB', 'chart-div') ?>

// With Blade Templates
@donutchart('IMDB', 'chart-div')
Rendered Chart
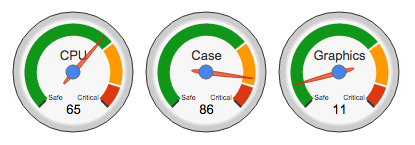
GaugeChart Example
Controller
<?php

use Khill\Lavacharts\Lavacharts;

$lava = new Lavacharts; // See note below for Laravel

$temps = $lava->DataTable();

$temps->addStringColumn('Type')
      ->addNumberColumn('Value')
      ->addRow(['CPU', rand(0,100)])
      ->addRow(['Case', rand(0,100)])
      ->addRow(['Graphics', rand(0,100)]);

$lava->GaugeChart('Temps', $temps, [
    'width'      => 400,
    'greenFrom'  => 0,
    'greenTo'    => 69,
    'yellowFrom' => 70,
    'yellowTo'   => 89,
    'redFrom'    => 90,
    'redTo'      => 100,
    'majorTicks' => [
        'Safe',
        'Critical'
    ]
]);
For Laravel, omit "$lava = new Lavacharts" and replace "$lava->" with "Lava::"
Otherwise, pass $gaugechart or $lava to your view to render.
View
Vanilla
<?php

<div id="temps_div"></div>
// With the lava object
<?= $lava->render('GaugeChart', 'Temps', 'temps_div') ?>
Laravel
<?php

<div id="temps_div"></div>
// With Lava class alias
<?= Lava::render('GaugeChart', 'Temps', 'temps_div') ?>

// With Blade Templates
@gaugechart('Temps', 'temps_div')
Rendered Chart
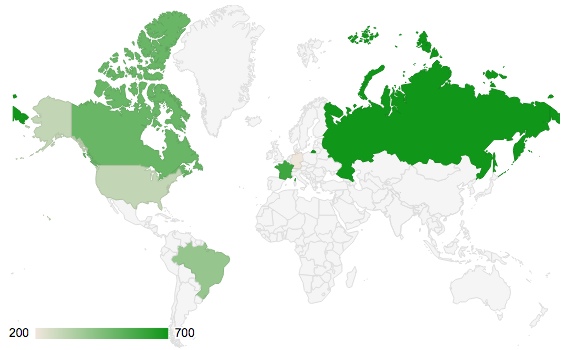
GeoChart Example
Controller
<?php

use Khill\Lavacharts\Lavacharts;

$lava = new Lavacharts; // See note below for Laravel

$popularity = $lava->DataTable();

$popularity->addStringColumn('Country')
           ->addNumberColumn('Popularity')
           ->addRow(array('Germany', 200))
           ->addRow(array('United States', 300))
           ->addRow(array('Brazil', 400))
           ->addRow(array('Canada', 500))
           ->addRow(array('France', 600))
           ->addRow(array('RU', 700));

$lava->GeoChart('Popularity', $popularity);
For Laravel, omit "$lava = new Lavacharts" and replace "$lava->" with "Lava::"
Otherwise, pass $geochart or $lava to your view to render.
View
Vanilla
<?php

<div id="pop-div"></div>
// With the lava object
<?= $lava->render('GeoChart', 'Popularity', 'pop-div') ?>
Laravel
<?php

<div id="pop-div"></div>
// With Lava class alias
<?= Lava::render('GeoChart', 'Popularity', 'pop-div') ?>

// With Blade Templates
@geochart('Popularity', 'pop-div')
Rendered Chart
PieChart Example
Controller
<?php

use Khill\Lavacharts\Lavacharts;

$lava = new Lavacharts; // See note below for Laravel

$reasons = $lava->DataTable();

$reasons->addStringColumn('Reasons')
        ->addNumberColumn('Percent')
        ->addRow(['Check Reviews', 5])
        ->addRow(['Watch Trailers', 2])
        ->addRow(['See Actors Other Work', 4])
        ->addRow(['Settle Argument', 89]);

$lava->PieChart('IMDB', $reasons, [
    'title'  => 'Reasons I visit IMDB',
    'is3D'   => true,
    'slices' => [
        ['offset' => 0.2],
        ['offset' => 0.25],
        ['offset' => 0.3]
    ]
]);
For Laravel, omit "$lava = new Lavacharts" and replace "$lava->" with "Lava::"
Otherwise, pass $piechart or $lava to your view to render.
View
Vanilla
<?php

<div id="chart-div"></div>
// With the lava object
<?= $lava->render('PieChart', 'IMDB', 'chart-div') ?>
Laravel
<?php

<div id="chart-div"></div>
// With Lava class alias
<?= Lava::render('PieChart', 'IMDB', 'chart-div') ?>

// With Blade Templates
@piechart('IMDB', 'chart-div')
Rendered Chart
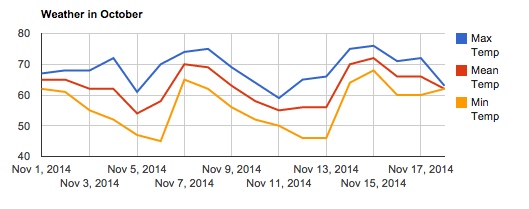
LineChart Example
Controller
<?php

use Khill\Lavacharts\Lavacharts;

$lava = new Lavacharts; // See note below for Laravel

$temperatures = $lava->DataTable();

$temperatures->addDateColumn('Date')
             ->addNumberColumn('Max Temp')
             ->addNumberColumn('Mean Temp')
             ->addNumberColumn('Min Temp')
             ->addRow(['2014-10-1',  67, 65, 62])
             ->addRow(['2014-10-2',  68, 65, 61])
             ->addRow(['2014-10-3',  68, 62, 55])
             ->addRow(['2014-10-4',  72, 62, 52])
             ->addRow(['2014-10-5',  61, 54, 47])
             ->addRow(['2014-10-6',  70, 58, 45])
             ->addRow(['2014-10-7',  74, 70, 65])
             ->addRow(['2014-10-8',  75, 69, 62])
             ->addRow(['2014-10-9',  69, 63, 56])
             ->addRow(['2014-10-10', 64, 58, 52])
             ->addRow(['2014-10-11', 59, 55, 50])
             ->addRow(['2014-10-12', 65, 56, 46])
             ->addRow(['2014-10-13', 66, 56, 46])
             ->addRow(['2014-10-14', 75, 70, 64])
             ->addRow(['2014-10-15', 76, 72, 68])
             ->addRow(['2014-10-16', 71, 66, 60])
             ->addRow(['2014-10-17', 72, 66, 60])
             ->addRow(['2014-10-18', 63, 62, 62]);

$lava->LineChart('Temps', $temperatures, [
    'title' => 'Weather in October'
]);
For Laravel, omit "$lava = new Lavacharts" and replace "$lava->" with "Lava::"
Otherwise, pass $linechart or $lava to your view to render.
View
Vanilla
<?php

<div id="temps_div"></div>
// With the lava object
<?= $lava->render('LineChart', 'Temps', 'temps_div') ?>
Laravel
<?php

<div id="temps_div"></div>
// With Lava class alias
<?= Lava::render('LineChart', 'Temps', 'temps_div') ?>

// With Blade Templates
@linechart('Temps', 'temps_div')
Rendered Chart
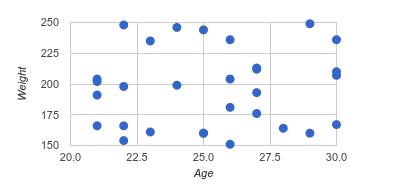
ScatterChart Example
Controller
<?php

use Khill\Lavacharts\Lavacharts;

$lava = new Lavacharts; // See note below for Laravel

$datatable = $lava->DataTable();
$datatable->addNumberColumn('Age');
$datatable->addNumberColumn('Weight');

for ($i=0; $i < 30; $i++) {
    $datatable->addRow([rand(20,30), rand(150,250)]);
}

$lava->ScatterChart('AgeWeight', $datatable, [
    'width' => 400,
    'legend' => [
        'position' => 'none'
    ],
    'hAxis' => [
        'title' => 'Age'
    ],
    'vAxis' => [
        'title' => 'Weight'
    ]
]);
For Laravel, omit "$lava = new Lavacharts" and replace "$lava->" with "Lava::"
Otherwise, pass $Scatterchart or $lava to your view to render.
View
Vanilla
<?php

<div id="chart-div"></div>
// With the lava object
<?= $lava->render('ScatterChart', 'AgeWeight', 'chart-div') ?>
Laravel
<?php

<div id="chart-div"></div>
// With Lava class alias
<?= Lava::render('ScatterChart', 'AgeWeight', 'chart-div') ?>

// With Blade Templates
@scatterchart('AgeWeight', 'chart-div')
Rendered Chart
Javascript
Extra functionality for your charts and dashboards.
Events
Enable interaction or add custom functions to charts with javascript events.
Adding an event your chart is as simple as defining a javascript callback / function in your page, then attaching the event to the chart.
Defining
To use events with your charts, follow these two easy steps:
- Define a javascript function within your page, before the any php render method. In the example below, the function is called "selectCallback"
- While configuring your chart in PHP, pass the event as an array key with the name of your javascript function as the value.
Acceptable events include:
- animationfinish
- error
- onmouseover
- onmouseout
- ready
- select
- statechange
<?php

// Server side
$lava->PieChart('MyChart', $data, [
    'events' => [
        'select' => 'selectCallback'
    ]
])
// In the view
function selectCallback (event, chart) {
// Useful for using chart methods such as chart.getSelection();
console.log(chart.getSelection());
}Lava.js
This is a module that will be added to the page, which is used by the library. It also provides some extra functionality to interact with your charts via javascript.
Methods
lava.getChart(chartLabel, callback)
Pass in a chart label and a callback, to get access to the google chart, and the lavachart.
lava.getChart('myFancyChart', function (googleChart, lavaChart) {
    console.log(googleChart);
    console.log(lavaChart);
});lava.getDashboard(dashboardLabel, callback)
Pass in a dashboard label and a callback, to get access to the google dashboard object, and the lavachart.
lava.getDashboard('myFancyDashboard', function (googleDashboard, lavaDashboard) {
    console.log(googleDashboard);
    console.log(lavaDashboard);
});lava.loadData(chartLabel, dataTableJson, callback)
This method will allow you to update charts via ajax, loading data using a datatable's toJson() method.
lava.loadData('myFancyChart', {dataTableJsonObject}, function (chart) {
    console.log(chart);
});
Ajax Data Loading
Here is an example of how to load charts with ajax, using jQuery.
Server Side
<?php

$temps = $lava->DataTable('America/Los_Angeles');

$temps->addDateColumn('Date')
      ->addNumberColumn('Max Temp')
      ->addNumberColumn('Mean Temp')
      ->addNumberColumn('Min Temp');

foreach(range(1, 30) as $day) {
    $temps->addRow(array(
        '2014-10-'.$day,
        rand(50,90),
        rand(50,90),
        rand(50,90)
    ));
}

return $temps->toJson();
Page Script
$.getJSON('http://my.cool.site.com/api/whatever/getDataTableJson', function (dataTableJson) {
  lava.loadData('Chart1', dataTableJson, function (chart) {
    console.log(chart);
  });
});Frequently Asked Questions
Here are some solutions to real world problems.
Formatting a single cell
If you don't want to apply a format to an entire column, you can manually create a DataCell object with the value and format string.
Example
$data = $lava->DataTable();

$data->addNumberColumn('Values')
     ->addRow([15])
     ->addRow([22])
     ->addRow([26])
     ->addRow($lava->DataCell(31, 'Thirty One'))
     ->addRow([43])